Cyber-Threat Intelligence Dashboard for Financial Organizations
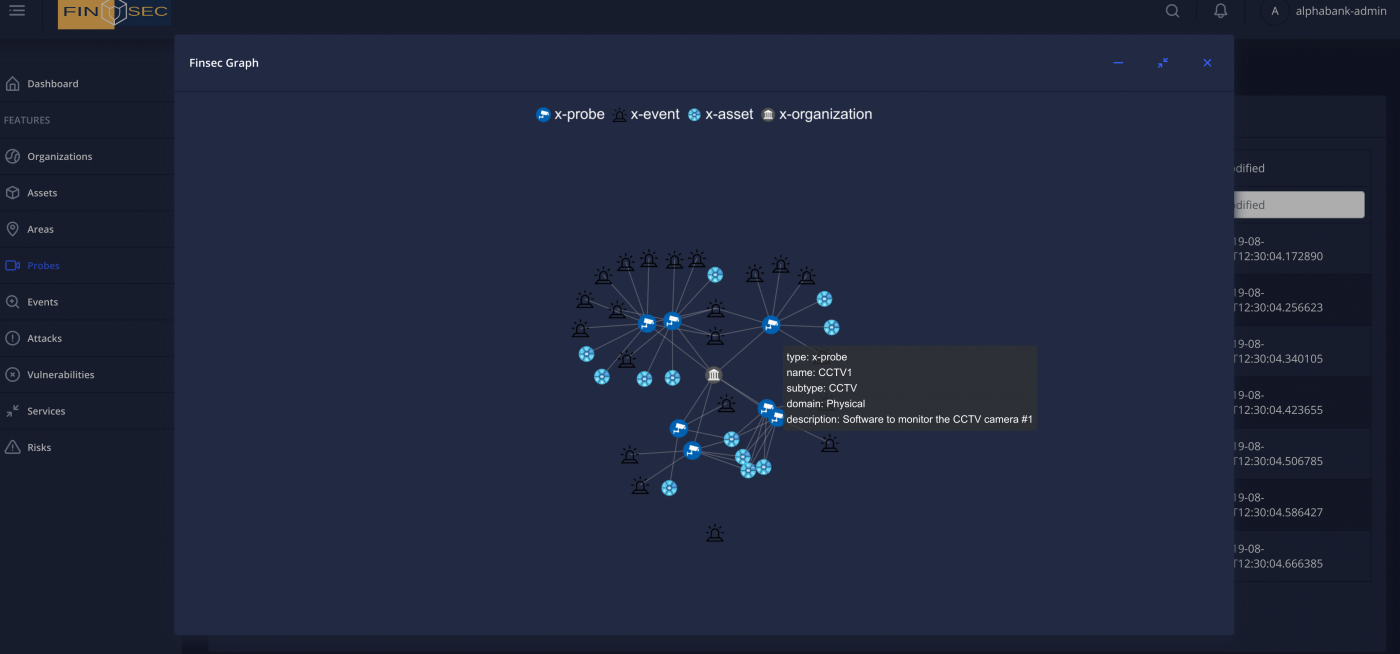
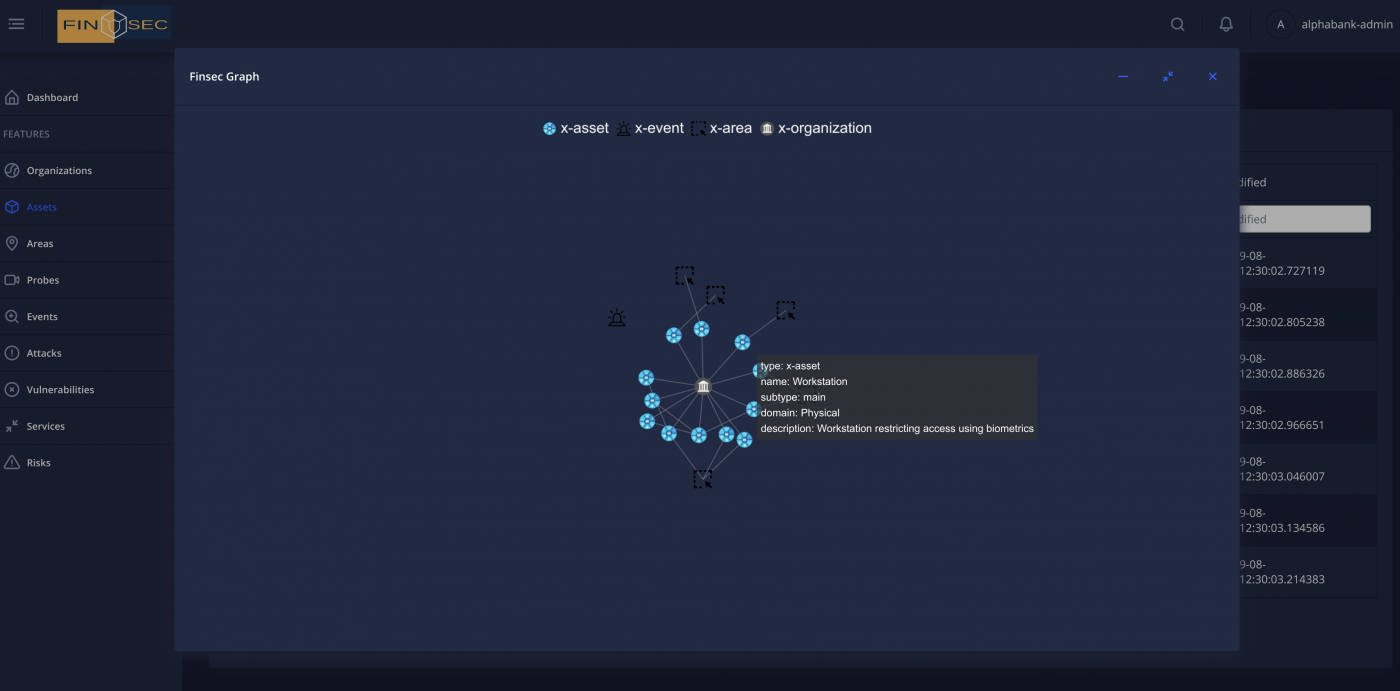
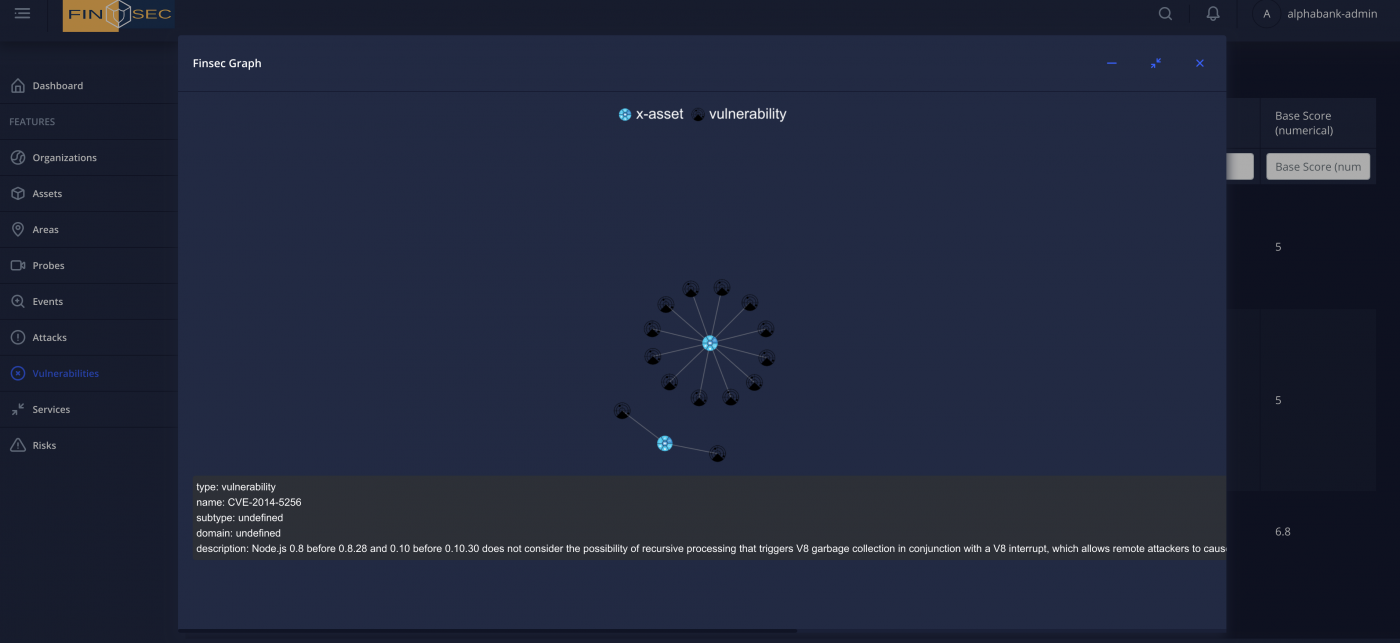
The FINSEC Dashboard was completely re-skinned aiming to provide a more self-explanatory and user-friendly interface. Security operators have still an overview of the data through visualization charts, graphs and tables which provide as much detail as possible. The FINSTIX objects are supported and are now fetched either directly from the data-layer, or from the service tier components. Apart from data and aggregated information, the FINSEC Dashboard now supports actuation functionalities like creating or updating FINSTIX Objects.
The authentication/authorization is handled by the JWT Keycloak [4] access management service, while real-time notifications are also introduced. SMEs and detected stakeholders are also available providing a direct way of communication between them.
New services are now integrated, and a real-time notification mechanism is used to provide fast feedback to system users. The following paragraphs describe in more technical depth the improvements made as well as a user story to fully demonstrate the service’s value.
Technology architecture
A new microservice has been deployed to fully support real-time and email notifications. The new component is developed in Laravel 6 and is also using a local strage as a MySQL container. Its role is to keep track of the notifications and whether they are read by an Organization’s security officer. Additionally, it handles the bulk email notification process. Every time a predefined condition is met (e.g. “The Risk level is “Very High” for a specific service), the Dashboard takes over and sends emails to the Organization’s security officers. The dashboard component is developed on Angular 8 and thus this provides extra level of confidence that security issues and updates will be continued by Angular’s large community.
The Dashboard fetches data from a Security Collaboration Platform, which has been extended to provide and support FINSTIX data. Moreover, the Anomaly Detection Service is used to display detected attacks. Similarly, Predictive Analytics Service produces x-attack objects. However, these attacks are essentially prediction of attacks and have their own space in the current Dashboard view. The Mitigation Service provides more details on a scanned vulnerability and a possible mitigation (course-of-action) hence an extra logic is now introduced and of course, a new way of reacting to possible threats or attacks detected. Each suggested Course of Action is clearly displayed as a notification to an end-user providing insights on how they could handle a critical situation. Each already-applied Course of Action, which was automatically applied by the mitigation enabler, is also shown, providing a complete picture of the Organization’s security state.
Infrastructure data are not provided by any FINSEC service. Thus, the Dashboard fetches infrastructure data directly from the FINSEC Data Tier. The same stands for information regarding vulnerabilities and threats stored inside the Security KB.
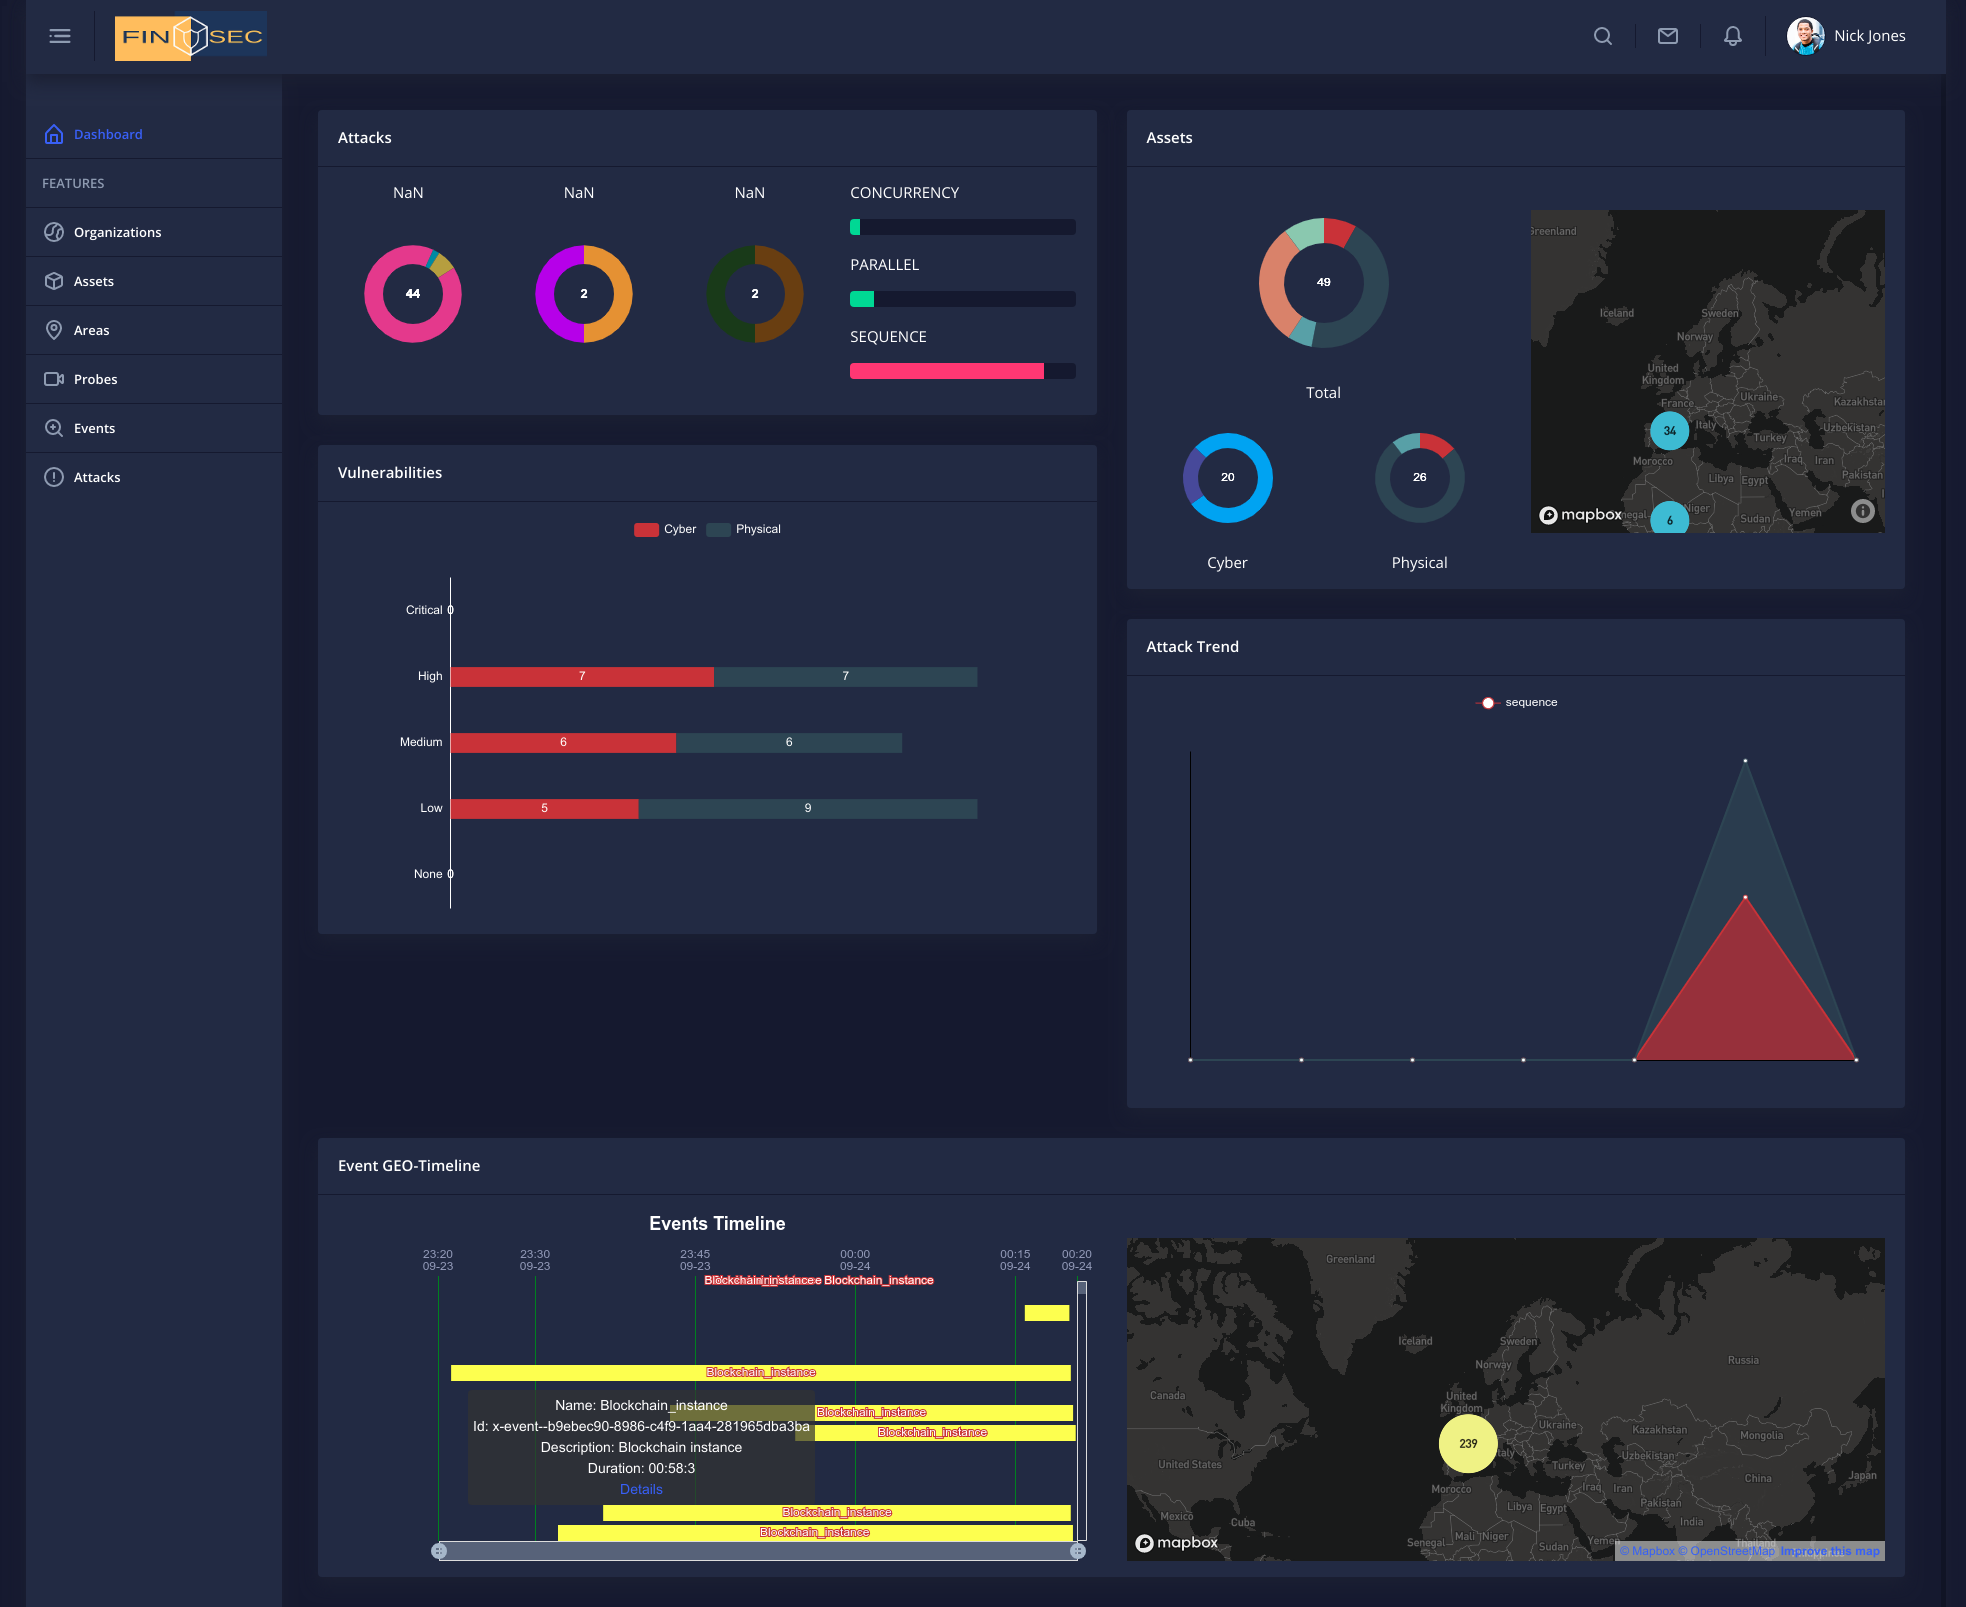
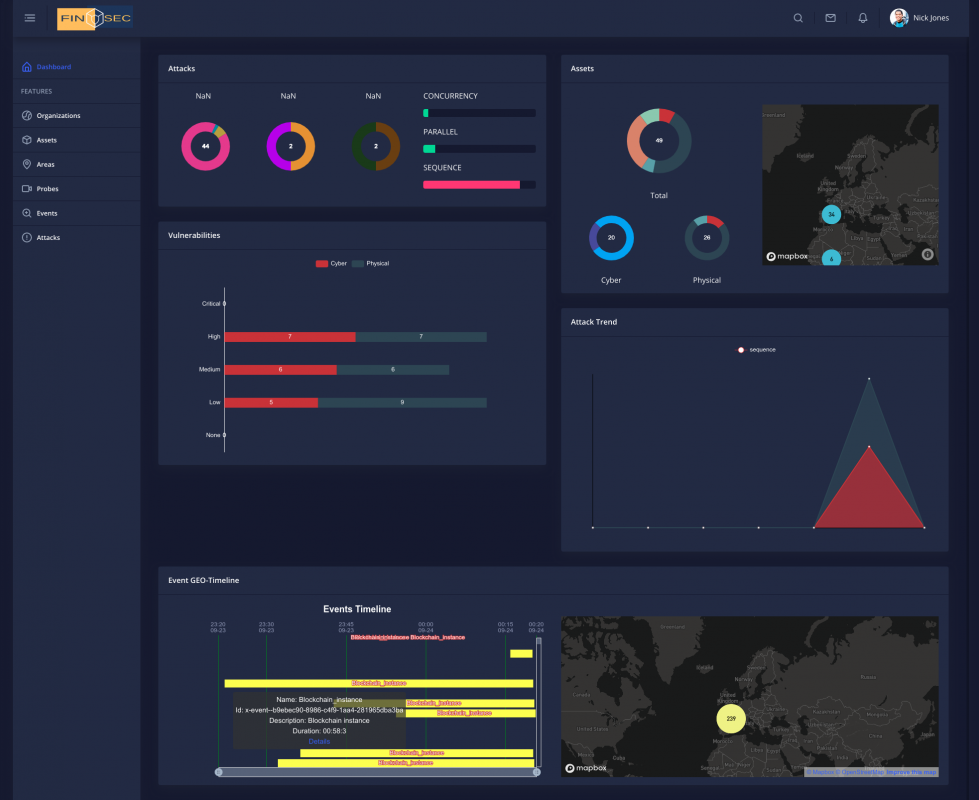
As soon as the security officer logs in the Dashboard, the home page is displayed. As illustrated in the Figure below, it provides a high-level overview of the home page. As shown in the figure, the attack types detected during the previous month, the asset composition of the Organization, the events detected as well as the vulnerabilities of the infrastructure are presented in a chart form. This fact can provide a quick overview of the Organization’s current state which can be very useful for the security officer.
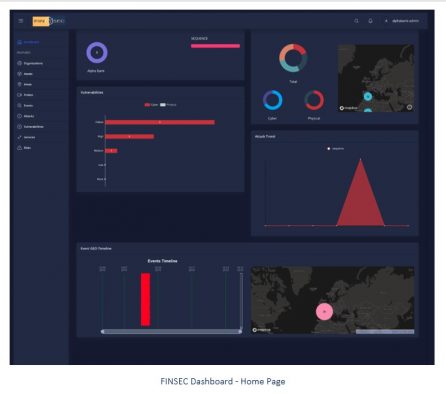
More information on the Dashboard demo is available in the Securing Critical Infrastructures in the Financial Sector course.
Innovation
The main innovation of the dashboard lies in its ergonomic design, aesthetics and ease of use.
more information
CONTACT 1
Ioannis Karagiannis
CONTACT 2
Dimitris Drakoulis
CONTACT 3
INNOV-ACTS


Reviews
There are no reviews yet.