In a microservices based Kubernetes environment, it is crucial to have a robust monitor system to gather information about the Kubernetes cluster resources, in order to keep a close eye on how things are performing in real-time.
After all, being able to recognize potentially problematic patterns or how Kubernetes is handling specific workloads can prevent service failures, possibly making the right actions before the problem occurs.
While Prometheus is a general-purpose monitor tool, it has become the de facto standard for microservices monitoring because it is ready to gather the kube-state-metric exposed natively by Kubernetes. Prometheus is always used with two other components:
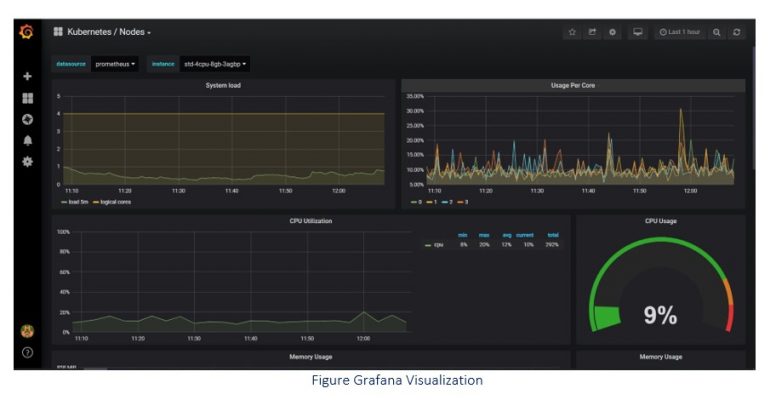
- Grafana: a powerful graphic tool natively integrated with Prometheus which give at glance a precise idea of the cluster status (see Figure below).
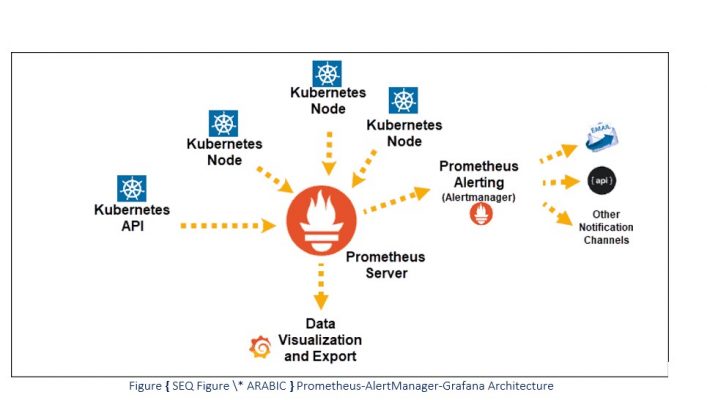
- AlertManager: a component which permits to send alerts in various ways (see Figure 48 Prometheus-AlertManager-Grafana Architecture).

In the end, the whole package [Prometheus + AlertManager + Grafana] helps with:
- Proactive resource monitoring;
- Cluster visibility and capacity planning;
- Trigger alerts and notification;
- Metrics dashboards.
As illustrated in the Figure below the Prometheus server pulls information from Kubernetes nodes and store them in its database, then such data are sent to Grafana for proper visualization.The actual alert conditions are configured using the Prometheus native language (PromQL). AlertManager classifies and groups them based on their metadata (labels), and optionally mutes or notifies them using a receiver (webhook, email, PagerDuty, etc).


Reviews
There are no reviews yet.